Your first hour in the terminal.
Seven short walkthroughs, in the order a first session tends to go: open a company, check its sources, change a number, preview a readout, keep the case. Each one works on a sample company without an account, so you can follow along in a second tab.
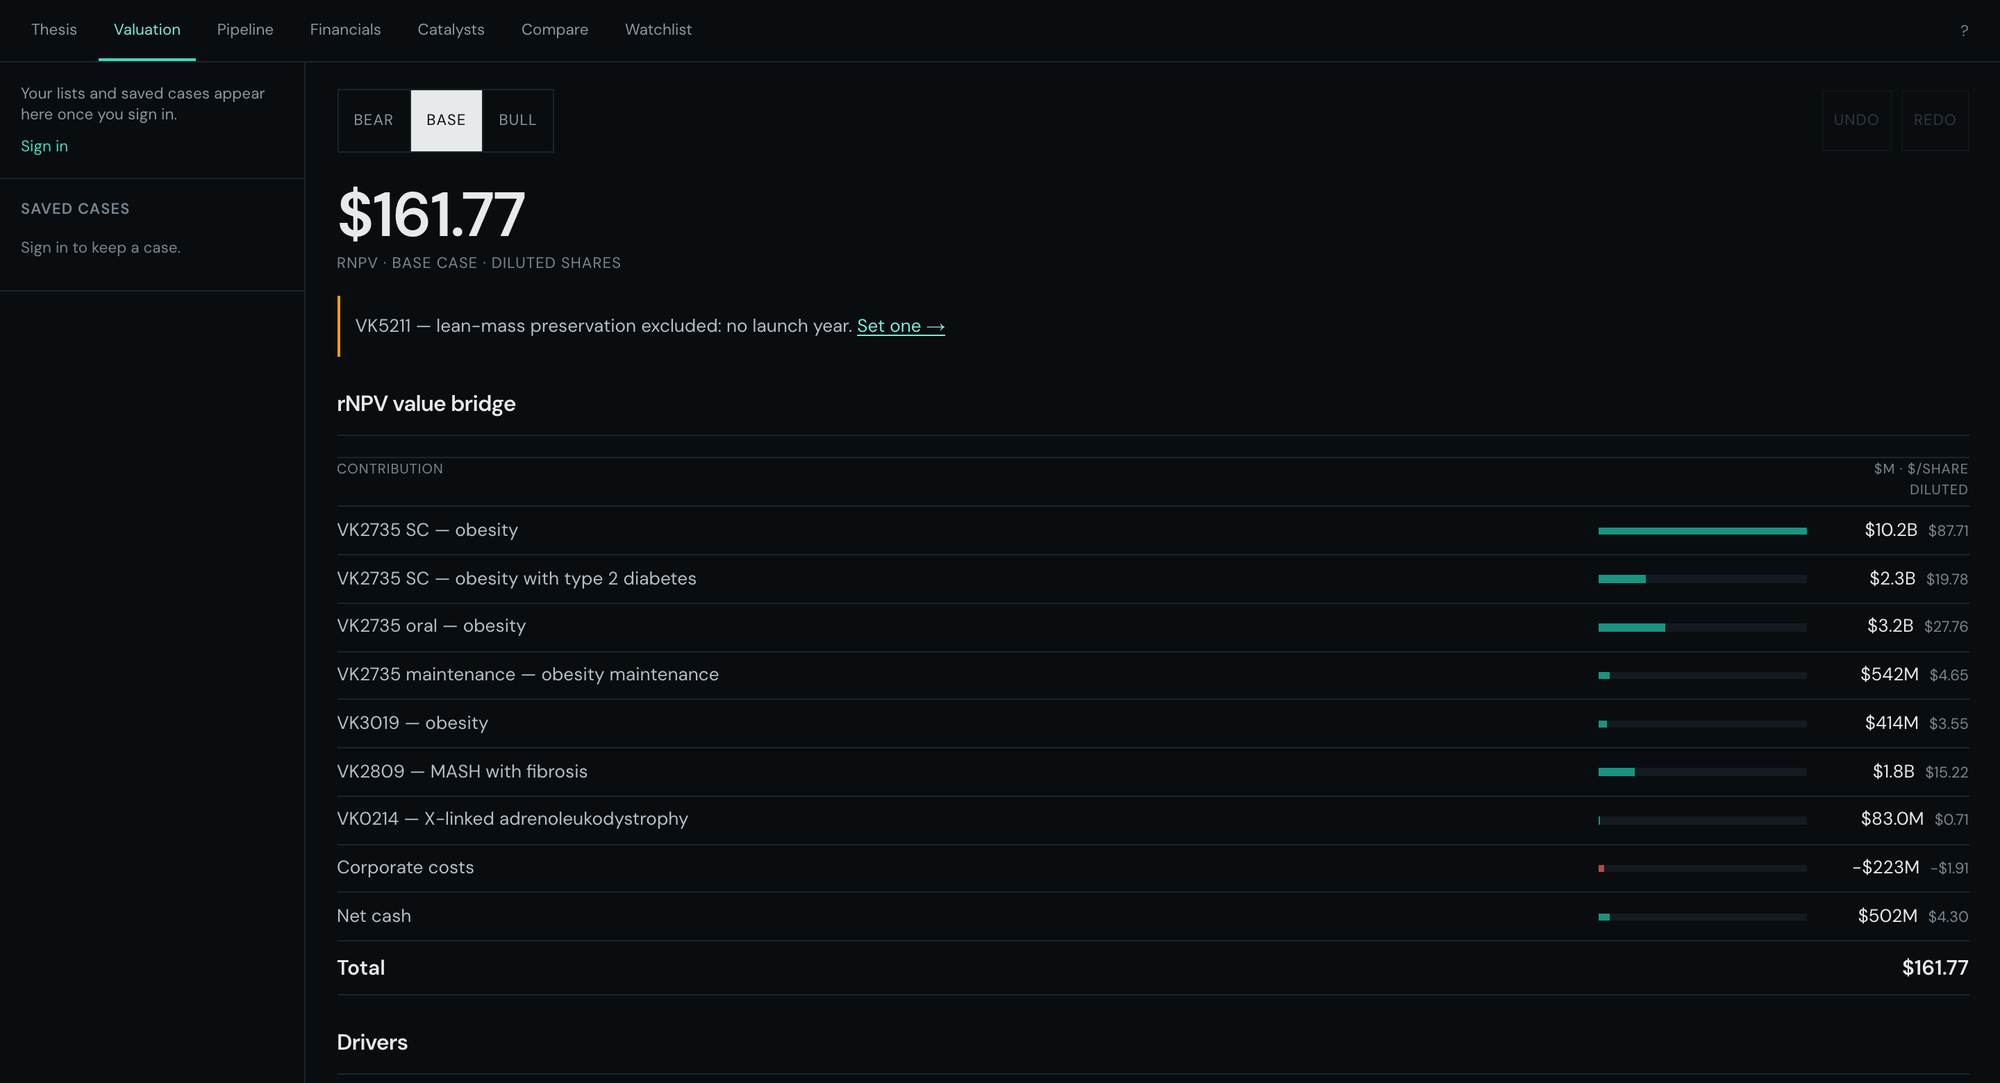
Every image on this page is a capture of the terminal on the Viking Therapeutics and Moderna samples. Research carries a date and refreshes, so the numbers you see will differ from the ones here.
Five regions. Each answers one question.
The terminal is one page. Nothing opens in a new window, and nothing you click loses the model you were looking at.
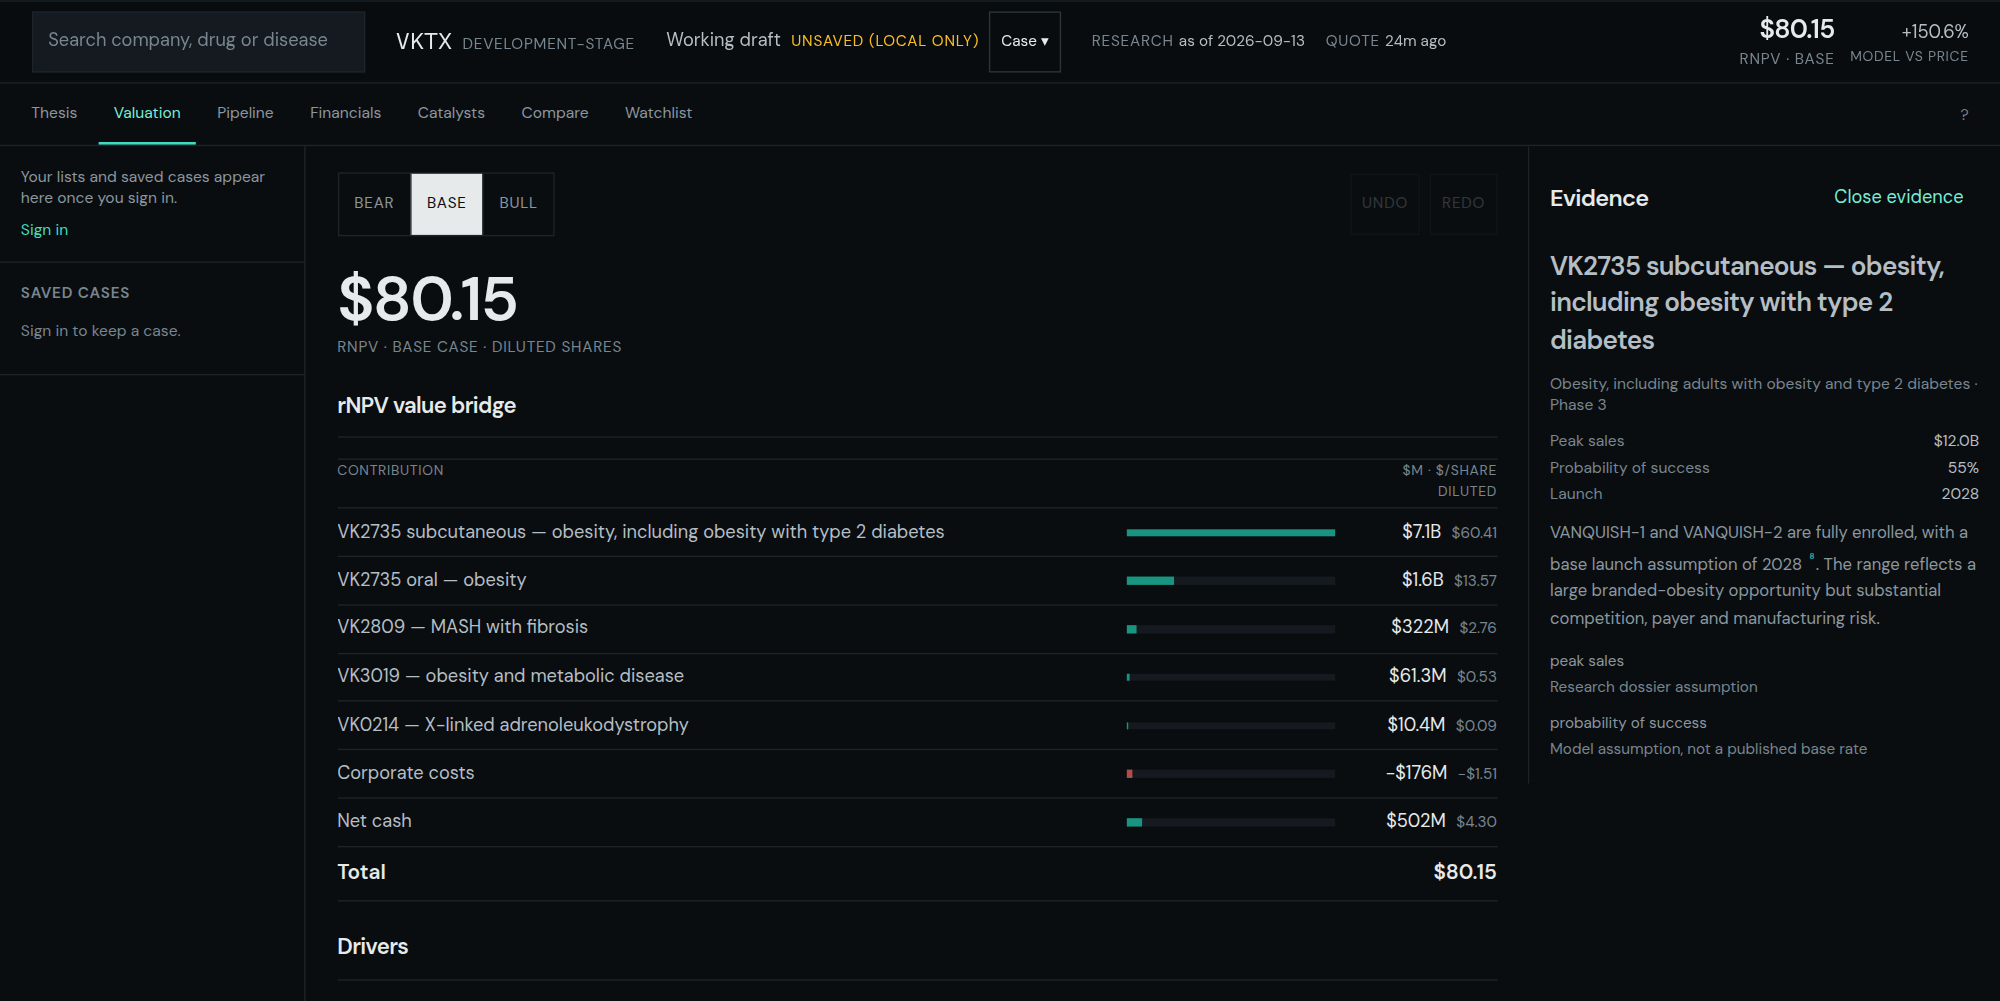
- 01
Command bar
Across the top. Which company, which case, saved or not, when the research was read, when the quote was taken, and the headline value with the method behind it. It does not scroll away.
- 02
Panel strip
Thesis, Valuation, Pipeline, Financials, Catalysts and Compare, plus the Watchlist home. The keys 1 to 6 switch between the six.
- 03
Rail
Down the left. Your lists and saved cases, each with its price. It fills in once you sign in.
- 04
Workspace
The panel you are reading. It is the only part of the screen that scrolls, and it remembers where you were on each panel.
- 05
Evidence pane
Opens on the right when you click a drug, a valuation line, a disease or a source, so the evidence sits beside the number it supports. Escape closes it.
- Two clocks
The command bar keeps the research date and the quote time apart. Research is dated to the day the dossier was read. The quote carries its own time and says so when it is stale. A fresh price never makes old research look current.
Open a company and read what it is.
Start with a company you already follow. It is the quickest way to judge whether the research matches what you know.
- 01
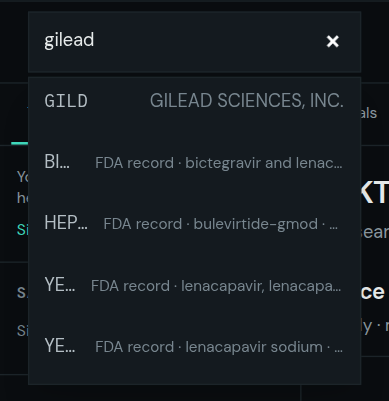
Click the search box in the command bar, or press the slash key. Type a ticker or part of a company name. FDA approval records turn up in the same list under a drug's brand name, and open at their own page.
- 02
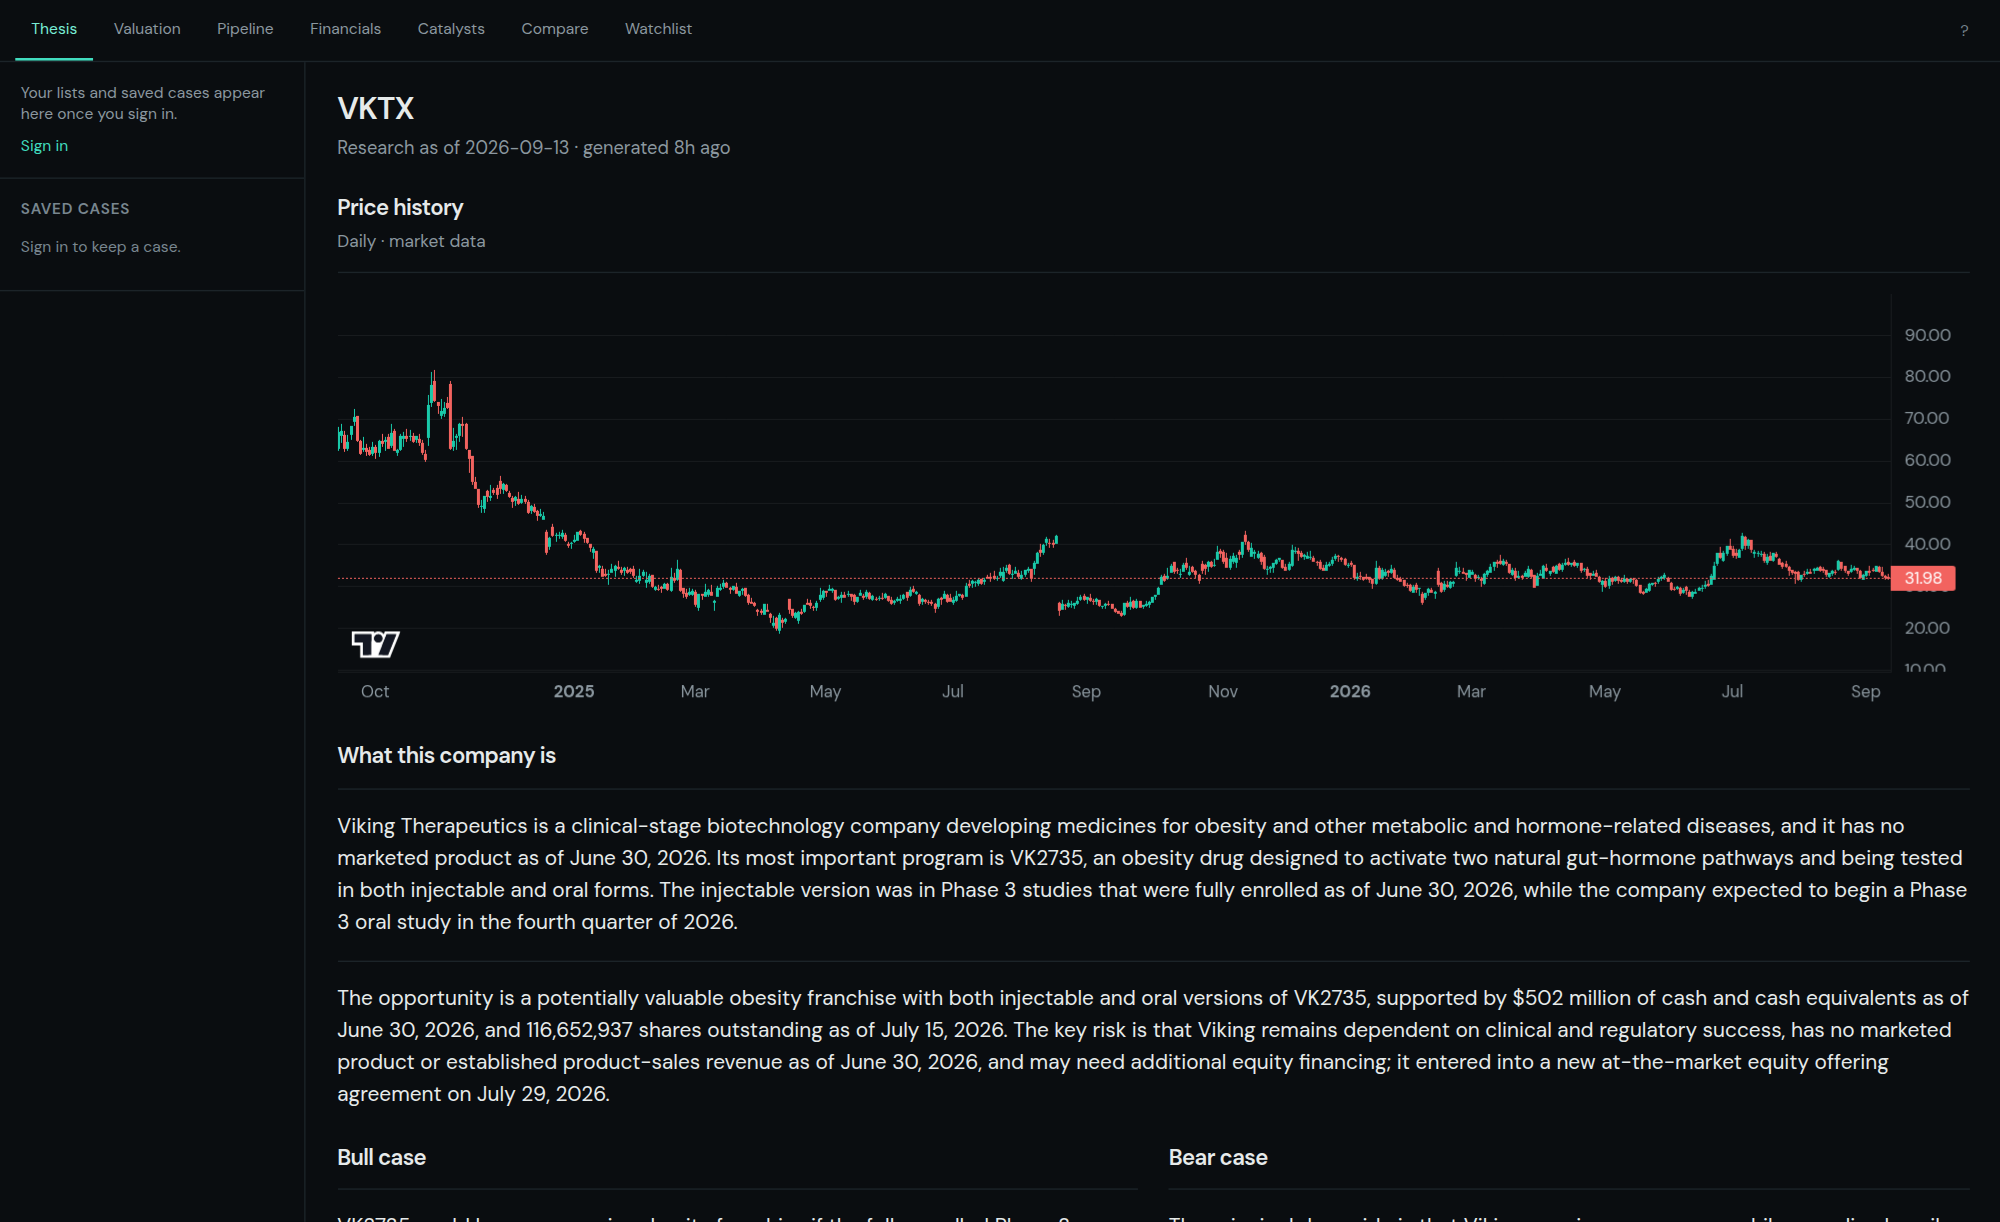
Pick the company. It opens on Thesis: the price history, a plain-English account of what the company is and the thesis for it, and the bull and bear cases from the research.
- 03
Look at the date under the company name. The research was read on that day. If nobody has opened the company before, the terminal researches it while you wait, about a minute, and shows which parts are done. It keeps going if you close the tab.
- 04
Scroll on for recent coverage and the list of documents the facts came from, each with a link to the original.
Follow a number back to its source.
Every figure in the terminal came from somewhere, and the somewhere is one click away.
- 01
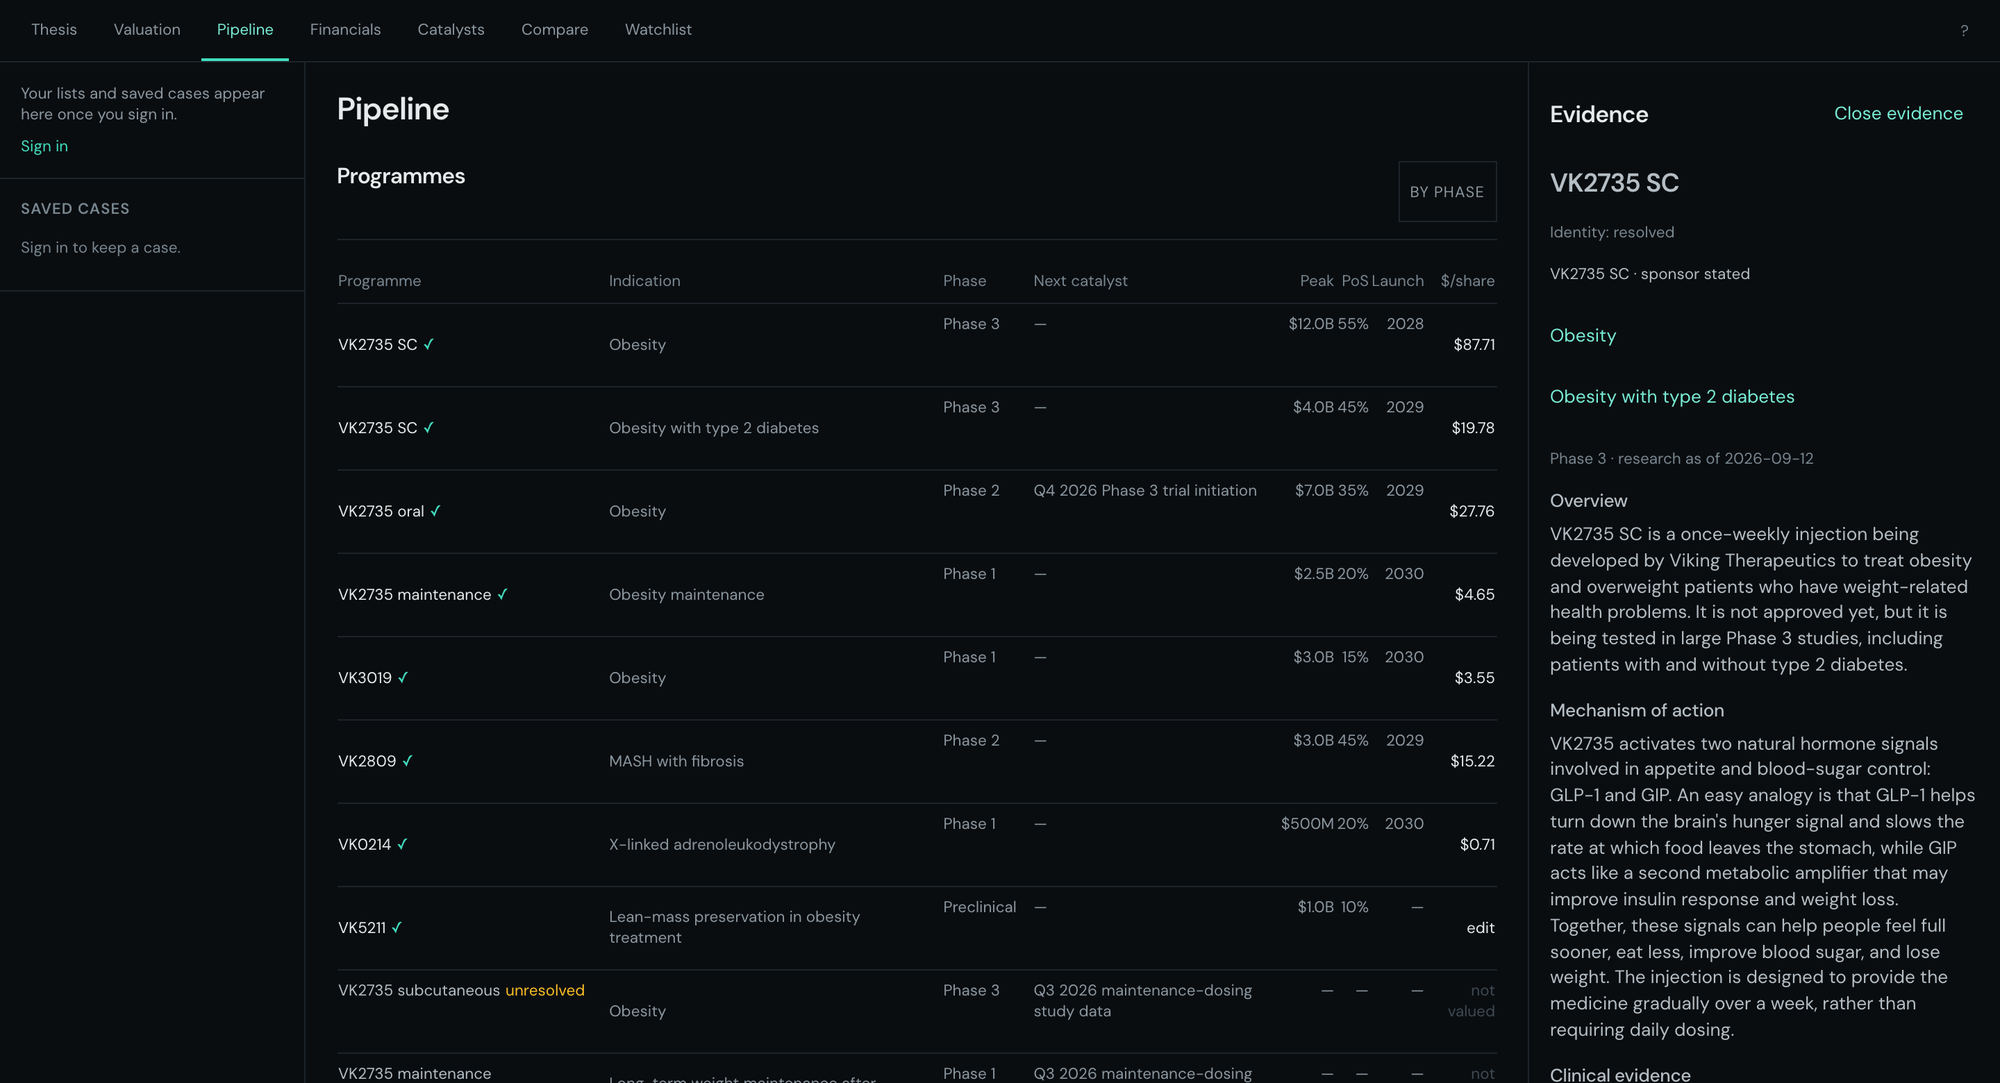
Open Pipeline. One row per programme and indication: its phase, its next catalyst, then the peak sales, probability of success and launch year the model uses for it, and the dollars per share that line contributes.
- 02
Click a programme name. The evidence pane opens beside the table: what the drug does, how its trials went and where it stands against rivals, in plain English. Claims link to the pages they came from.
- 03
Click the dollar figure at the end of a row to jump to that line's inputs on the Valuation panel. Click the indication to read the disease beside the case.
- 04
A tick beside a name means the programme was matched to the sponsor's own records. "unresolved" means the research described it but could not place it, so it is listed and not valued. Where a programme has an FDA approval record, the row links to it.
- 05
On Financials, each figure names its filing: the concept, the period it covers, the form, the accession number and the day it was retrieved. Click a row to see them, then "Inspect source beside case" to open the document itself.
Runway is worked out the same way, in the open: cash divided by the operating cash burn per quarter, with both inputs and the periods they cover printed next to the answer.
Disagree with a number? Change it.
A valuation is a set of assumptions and some arithmetic. The terminal shows both, and lets you change the first.
- 01
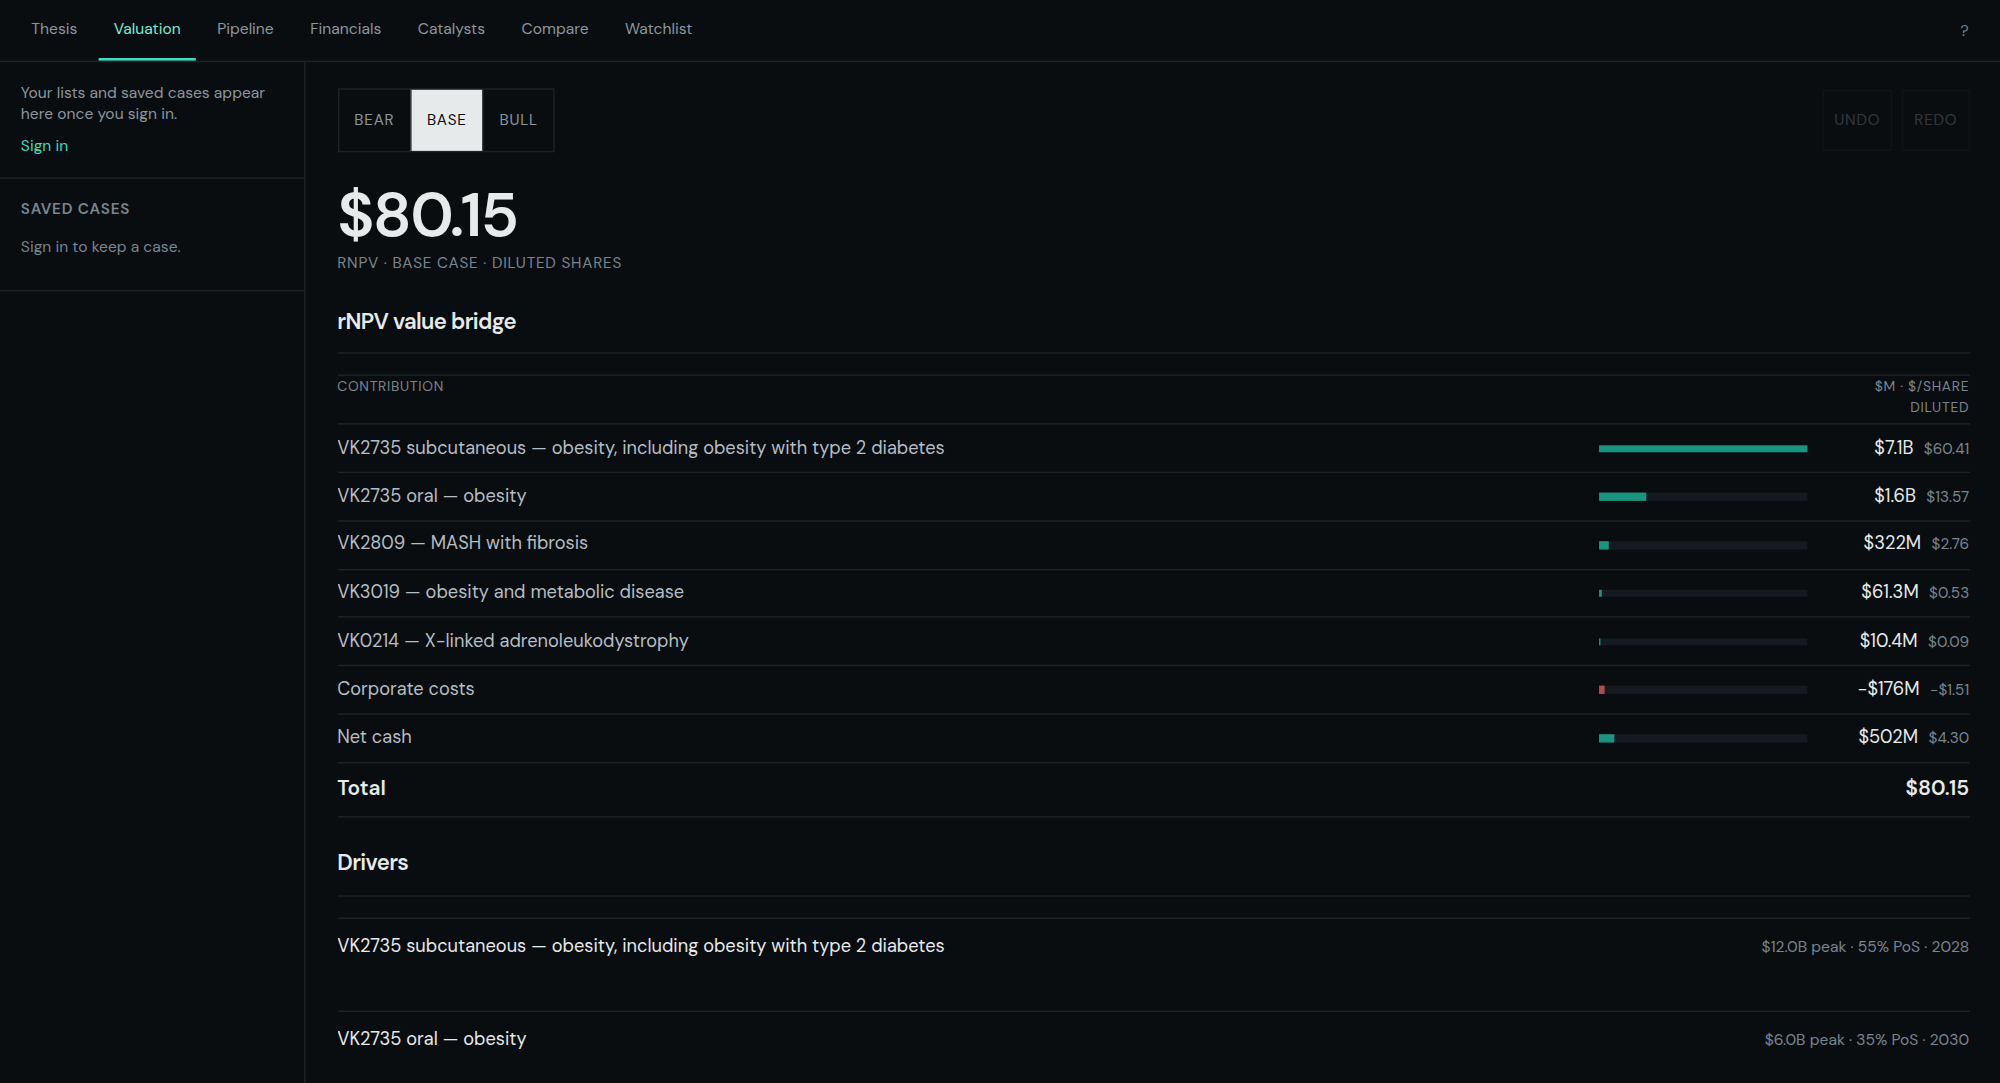
Open Valuation. The headline names its method, scenario and share basis on one line. The bridge under it is the same result in rows, one per programme, then corporate costs and net cash, and the rows add up to the headline.
- 02
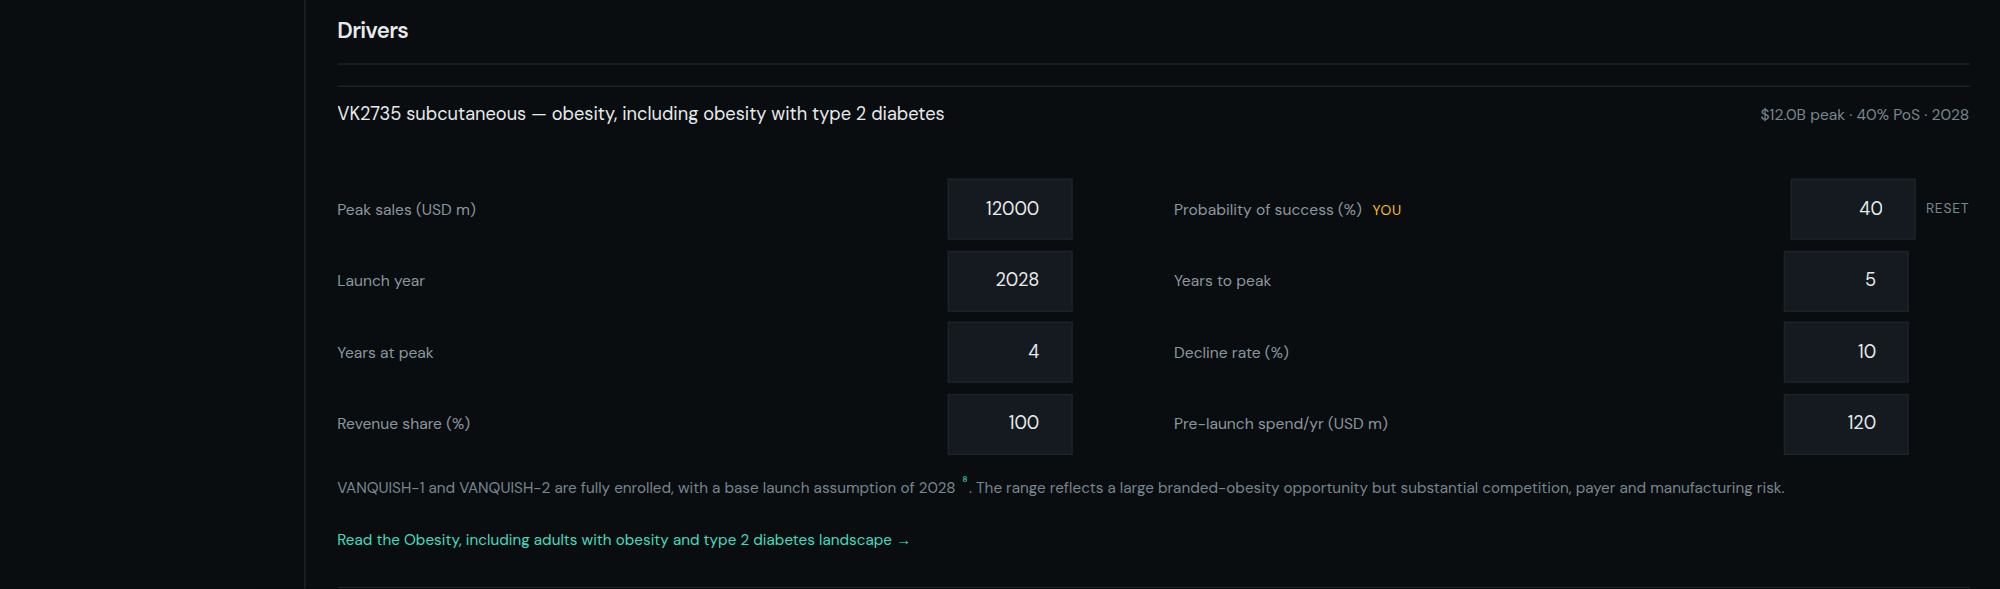
Scroll to Drivers and open a programme. Its inputs are there: peak sales, probability of success, launch year, years to peak, years at peak, decline rate, revenue share and pre-launch spend. The research's reasoning for them sits underneath.
- 03
Type a new number. The headline recalculates as you type, in your browser, with nothing sent to a server. The field is marked YOU and gets a Reset beside it.
- 04
Bear, Base and Bull are three assumption sets from the research. Your edits sit on top of whichever one is selected.
- 05
Undo, or ⌘Z, walks edits back one at a time. The label beside the button says what it would undo.
- 06
Go back to Thesis. A card called Your changes states what your edits did to the headline: the model run twice, before and after. It is arithmetic, not a rewritten paragraph.


What happens if the trial fails?
The events that move a biotech are scheduled. The terminal lists them with their dates and lets you price an outcome before it lands.
- 01
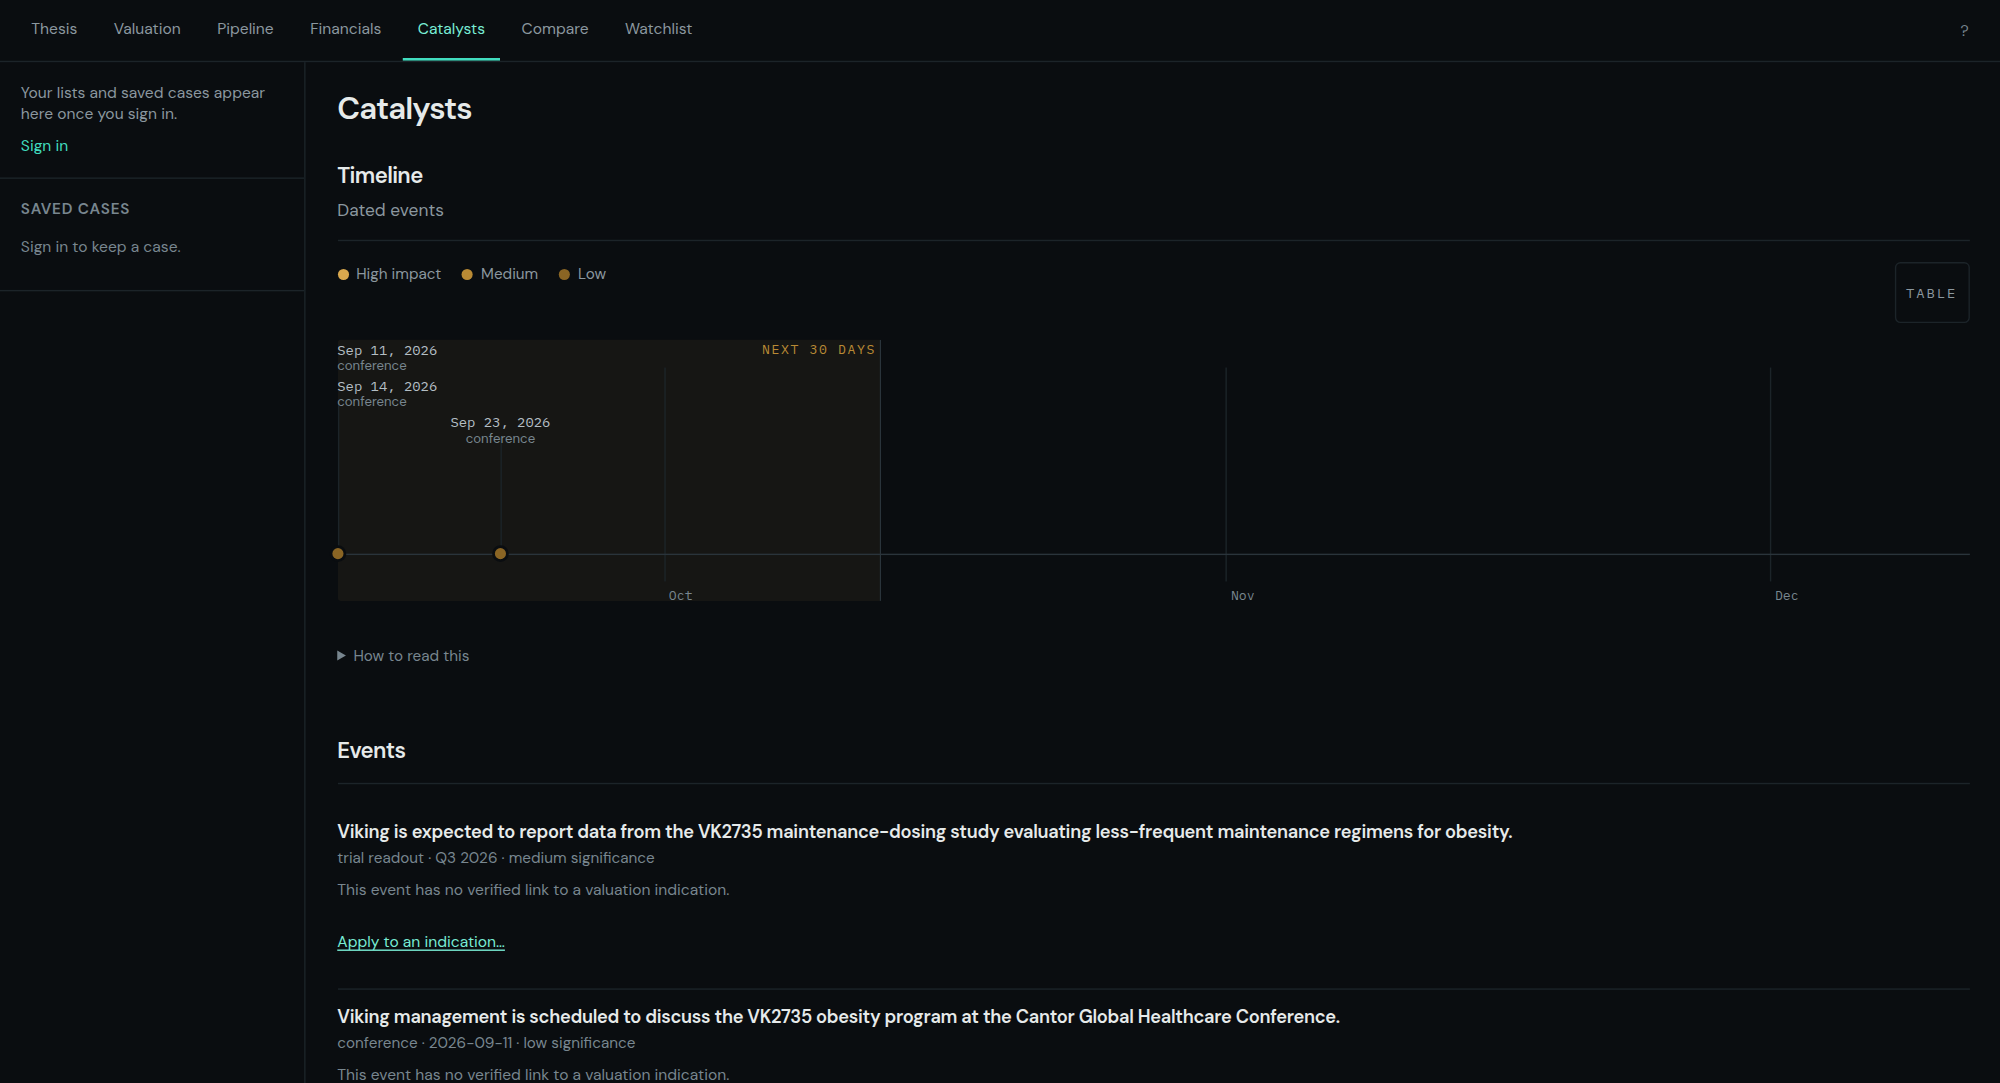
Open Catalysts. Each event has a type, a date with its precision, and a significance. When enough of them carry exact dates there is a timeline.
- 02
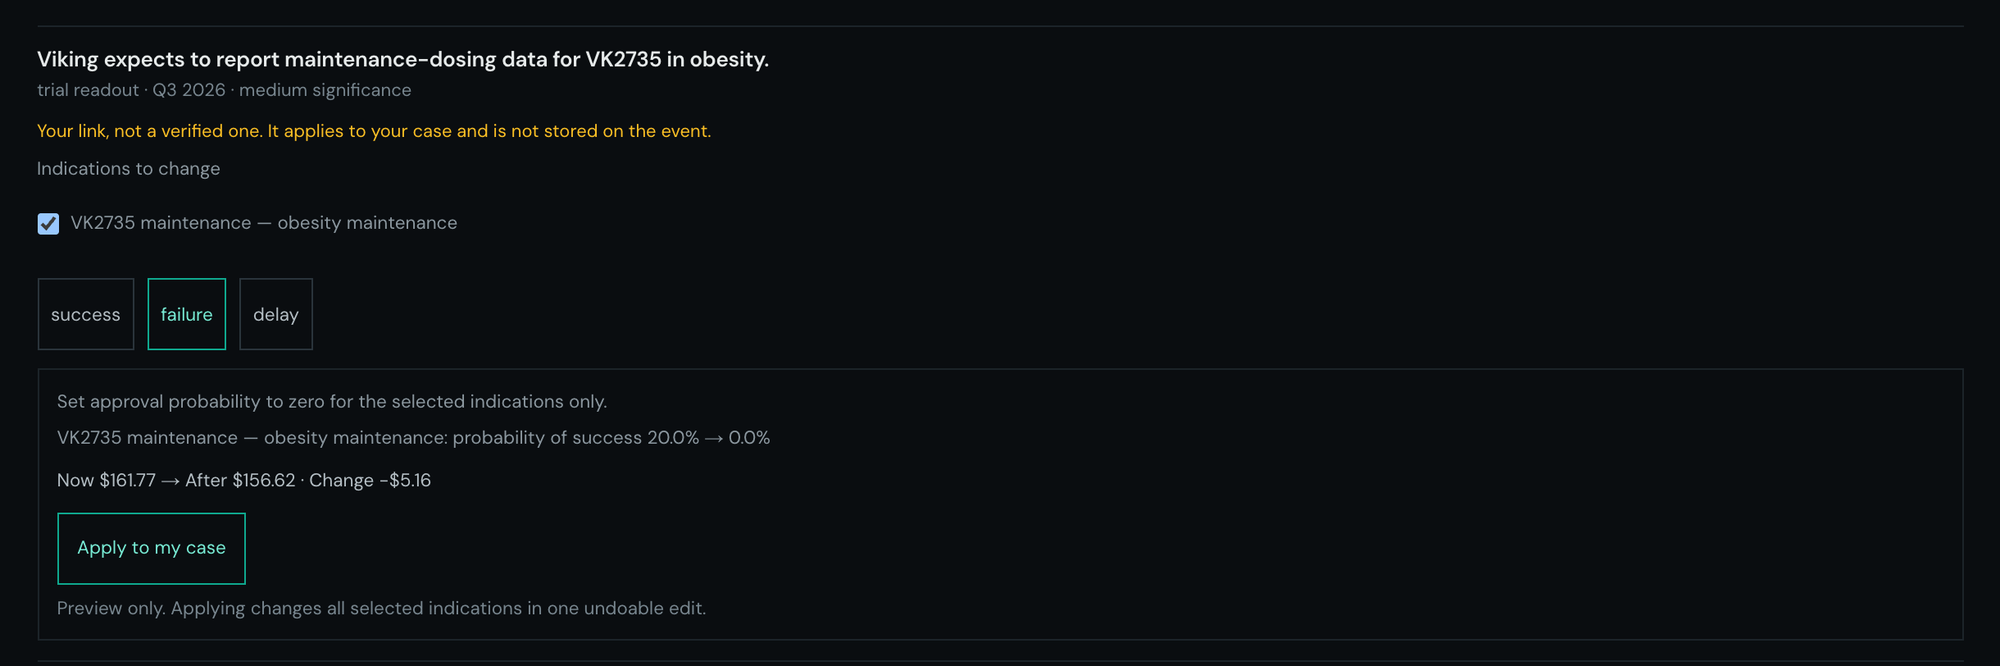
Under an event, the indications it would change. Where the research tied the event to a programme, they are listed. Where it only named the drug in passing, the terminal suggests the link and waits for you to confirm it. Nothing is assumed.
- 03
Pick success, failure or delay. Success asks for your post-event probability of approval; failure sets it to zero; delay moves the launch year out by one. The exact edit is written out, with the value now, after, and the change.
- 04
It is a preview. Nothing changes until you click Apply to my case, and applying is a single undoable edit however many indications it covers.
Event scenarios are never added up into a total value at risk. Two events can overlap, and a sum of their deltas would count the same drug twice.
The work stays where you left it.
A case is your version of the model, with a name, pinned to the research it was built on.
- 01
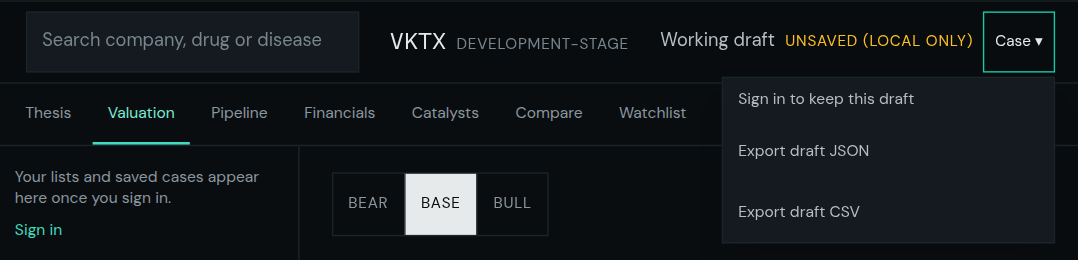
Without an account, your edits are kept on this browser and the command bar says so: Unsaved, local only. The Case menu exports the draft as JSON or CSV at any time.
- 02
Sign in and the badge offers to keep the draft. Name the case and save it, or press ⌘S. A case is private. Saving does not share your assumptions with anyone.
- 03
A saved case reopens to the same number next month and on another device, because the research it used is kept with it. It appears in the rail and on the Watchlist panel.
- 04
When newer research exists for a saved case, Thesis lists what changed, fact by fact with its source, and asks. Accepting makes a new revision. The one you saved stays exactly as it was.
- 05
A saved case exports as JSON or CSV, every input and result included. If a trial or subscription ends, saved cases stay readable and exportable.

Line companies up side by side.
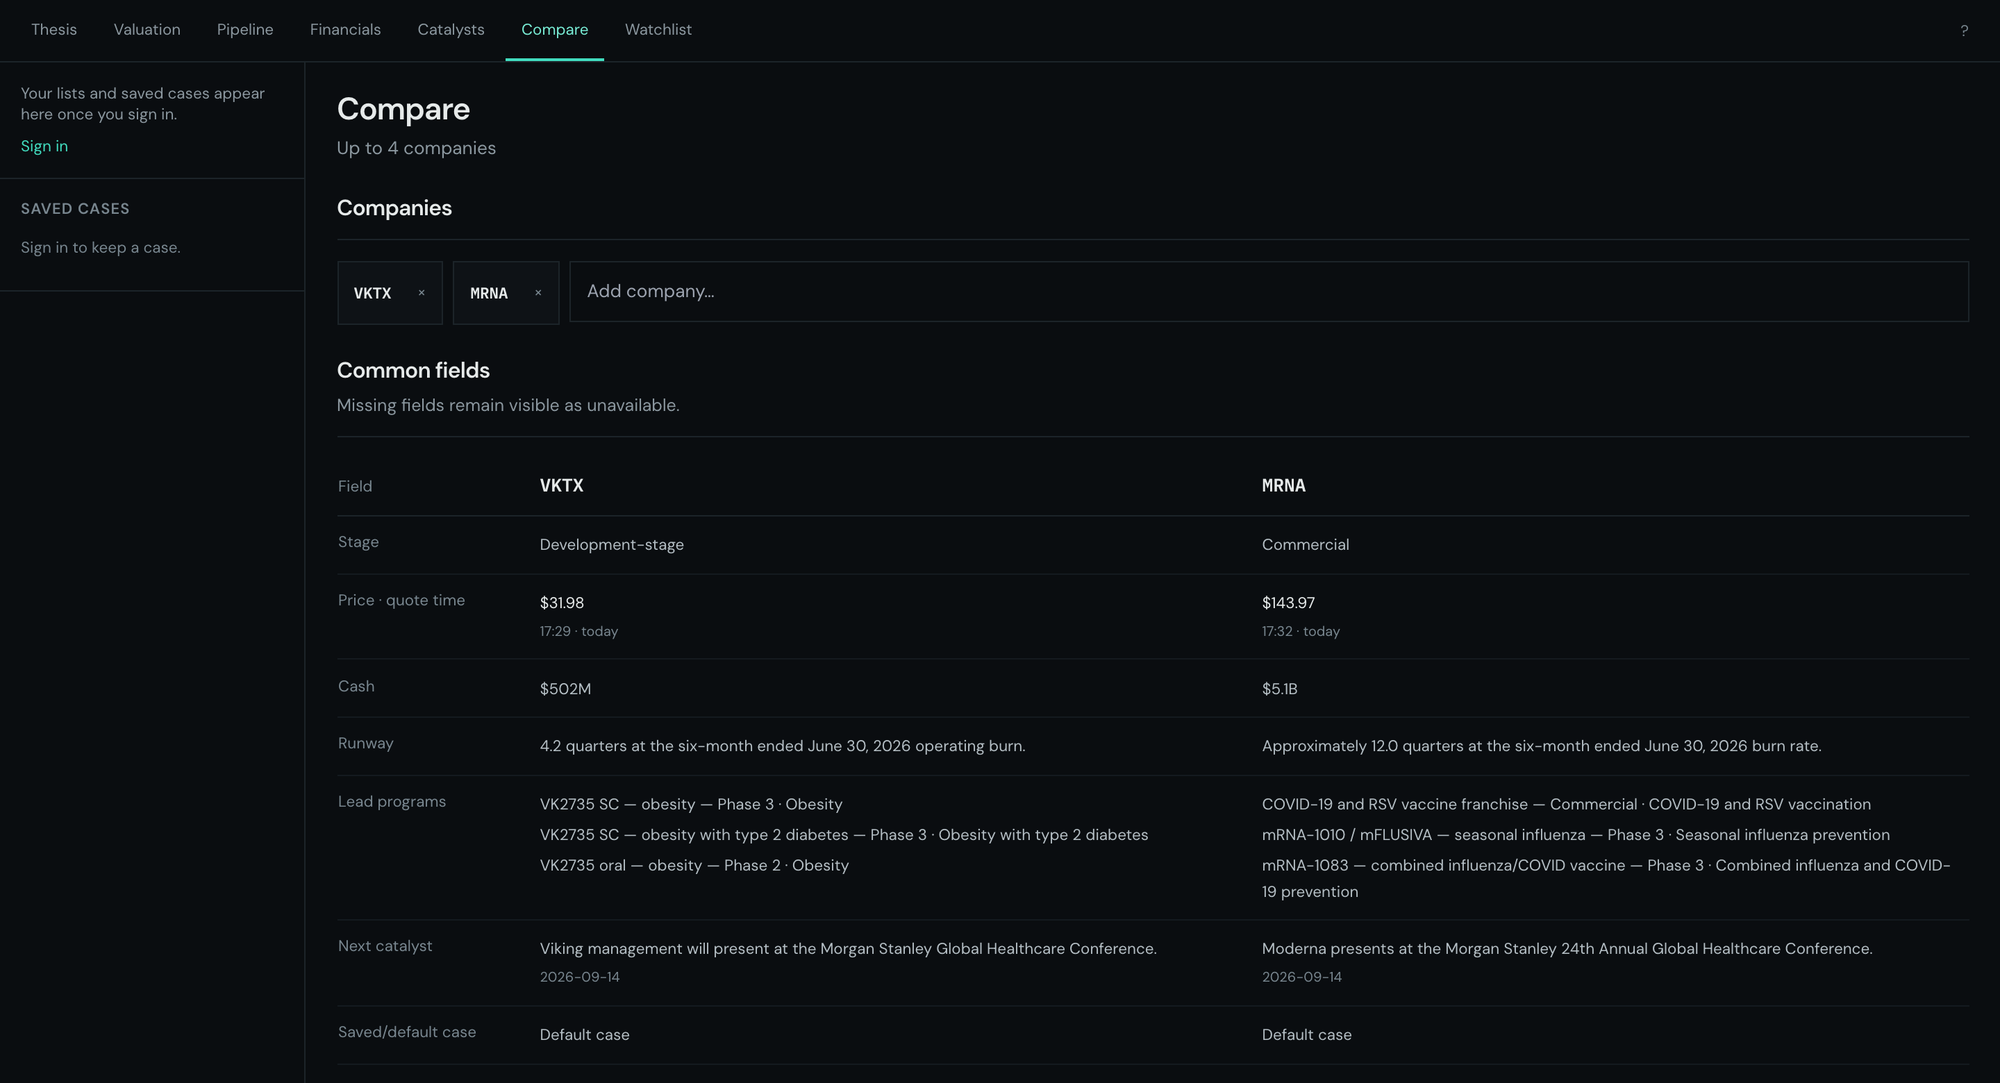
Cash beside runway is how you see which company has to raise money before its next readout.
- 01
Open Compare and add up to four companies from the search box in the panel.
- 02
Read across: stage, price with its quote time, cash, runway, lead programmes, the next dated catalyst, and which case each column is showing.
- 03
A field the research does not have stays on the table as unavailable. A blank never quietly reads as zero.
- 04
Each column keeps its own research date, method and share basis, so a per-share value in one column is not being normalised against another.
The method follows the company.
Viking has no product on sale, so it is valued drug by drug. Moderna sells vaccines, so its headline is an operating DCF. The terminal chooses, says which on the headline, and does not blend the two.
- 01
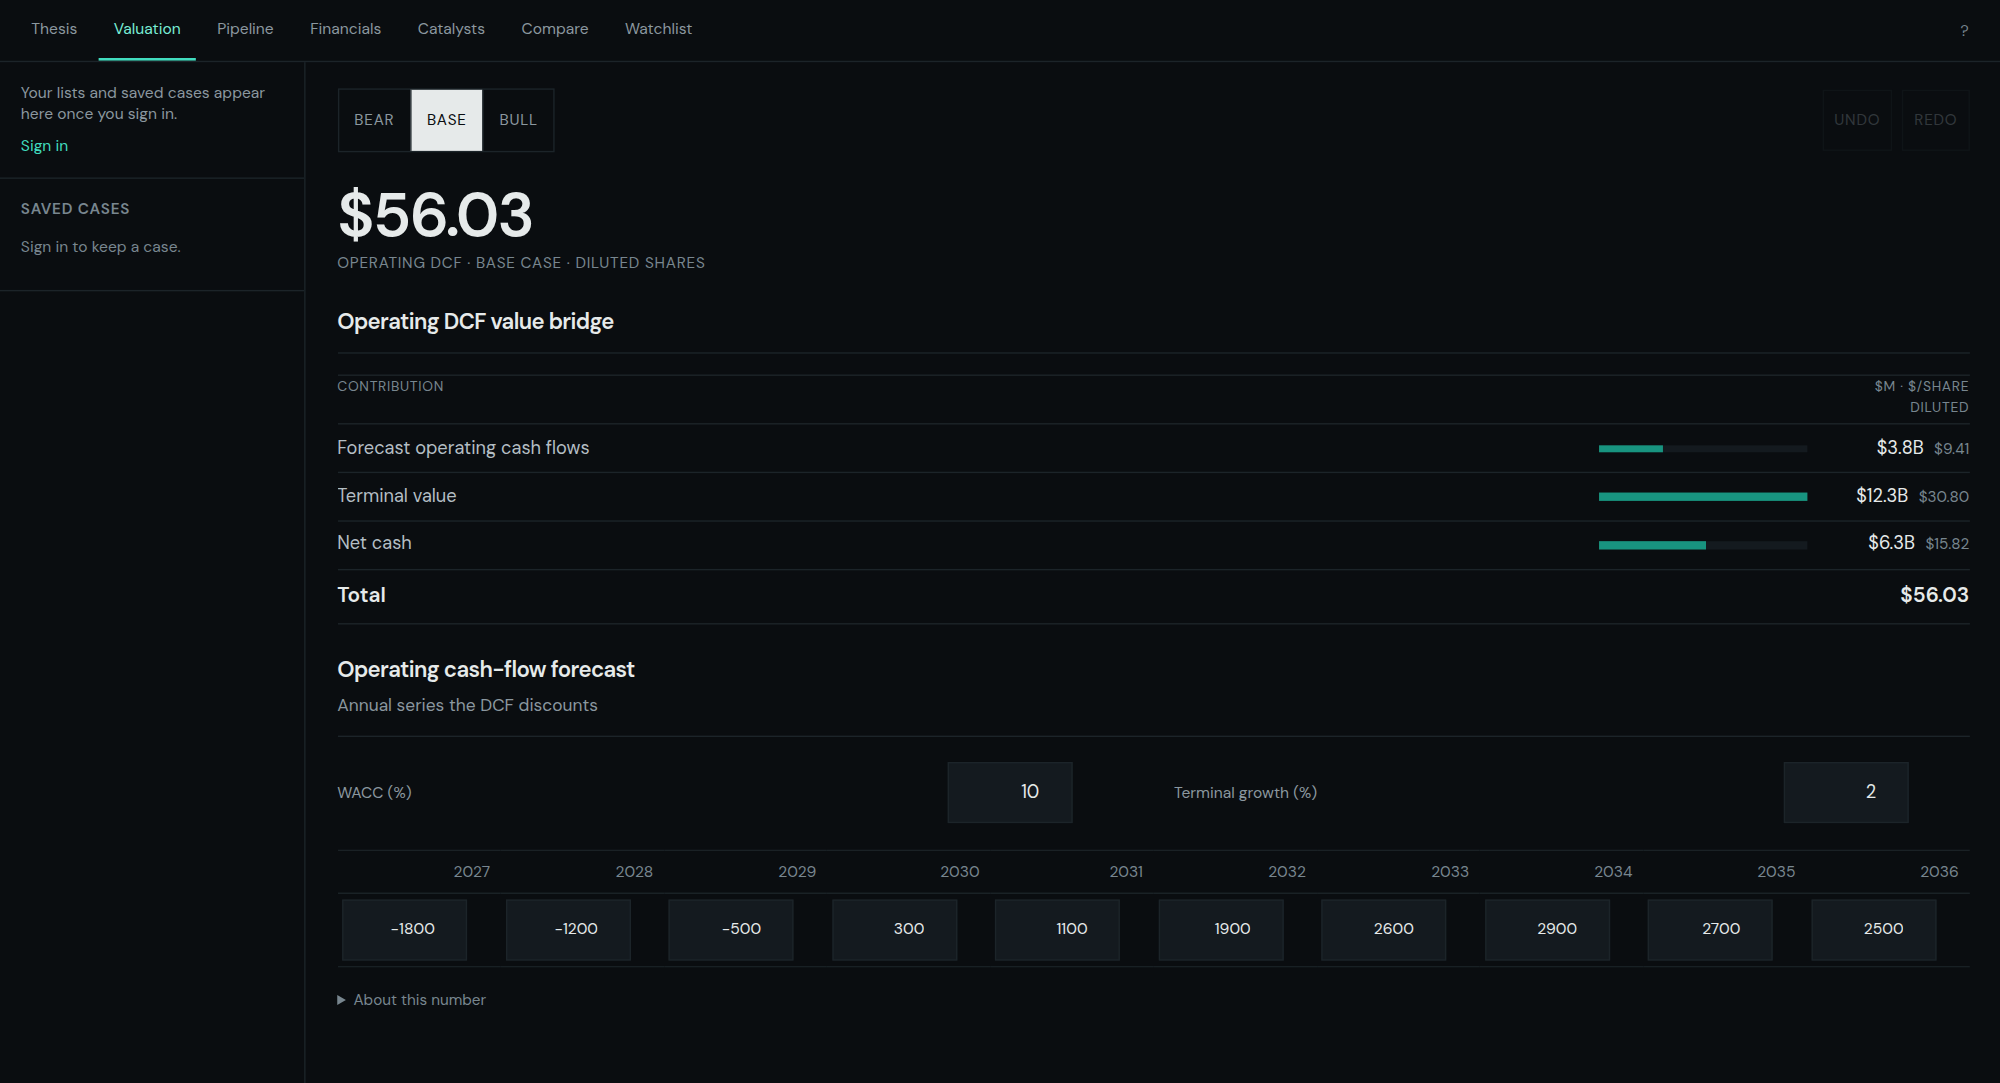
Open the Moderna sample on Valuation. The headline reads Operating DCF, and the bridge has three rows: forecast operating cash flows, terminal value and net cash.
- 02
The forecast is the editor you meet first. WACC, terminal growth and each year's cash flow are fields. Change any of them and the headline follows.
- 03
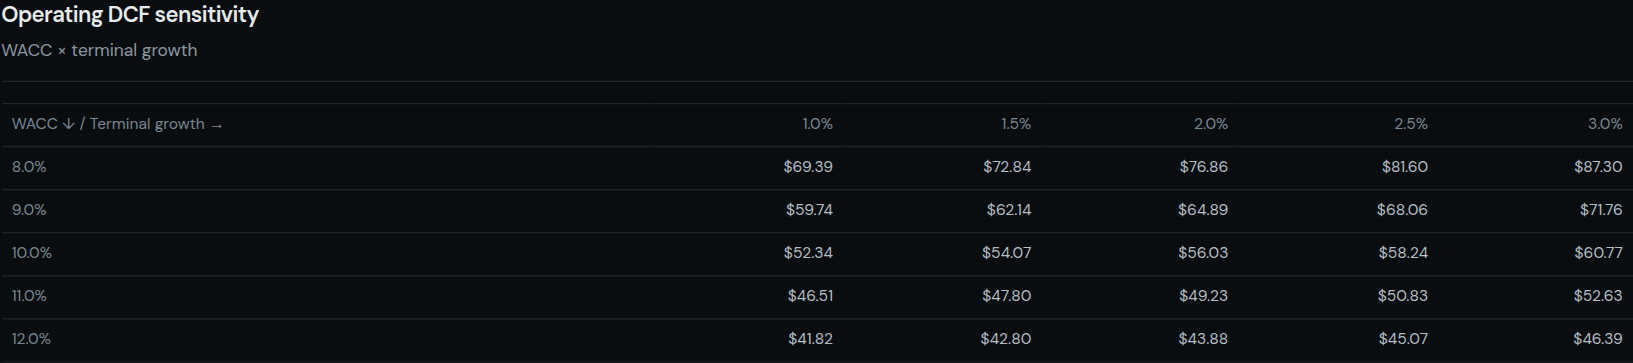
A sensitivity grid shows the same headline across nearby WACC and growth rates, so you can see how much of the number rests on the two inputs that are hardest to know.
- 04
The drug-by-drug rNPV is still there as a cross-check, with its own drivers. Editing those moves the cross-check, and the panel says so. A WACC at or below terminal growth is rejected, and no number is shown for it.
When the terminal says no, and what it means.
A gap beats a guess, so the terminal shows the gap and says what is missing. These are the states you will meet, and what each is telling you.
"Not valued" on a pipeline row
The research describes the programme but the model has no line for it. It stays on the list so you can see what was left out of the sum.
A line excluded from the headline
A programme missing an input the model needs, a launch year say, is dropped from the sum and named on the headline, with a link to set the missing value.
A stale quote
The price is marked stale, with its time. Where there is no price at all, no gap between model and price is shown either.
A missing financial fact
It says which kind of missing: not disclosed by the company, or not collected by the terminal. Neither is rendered as zero.
An invalid draft
If an edit makes the model impossible, the last valid headline stays on screen, labelled as such, and the field carries the reason.
A company that needs an account
Companies outside the 7 samples need a trial. The panel says so and offers a sample instead of a blank pane.

Shortcuts, and the address of every view.
Keyboard
- 1 – 6
- Move between the six research panels
- / or ⌘K
- Search
- ⌘S
- Save the case
- ⌘Z / ⇧⌘Z
- Undo and redo an assumption edit
- Esc
- Close the evidence pane
- ?
- Show this list inside the terminal
A digit typed in a search box goes into the box. Press Escape first.
Addresses
Every view has an address you can bookmark or send.
- /terminal?ticker=VKTX&panel=valuation
- Viking, straight to the valuation
- /terminal?ticker=MRNA&panel=catalysts
- Moderna, on its catalyst calendar
- /terminal?panel=compare&compare=VKTX,MRNA
- The two side by side
Your assumptions never go into the address. A link you send carries the view, not your case.
Words the terminal uses.
- Research
- A dated copy of everything read about a company: its facts, their sources and the model's baseline assumptions. It does not change once made. A refresh makes a new copy beside it.
- Case
- Your named, private version of a company's model: a scenario plus your edits, pinned to the research it was built on.
- Draft
- Edits that are not saved yet. They are kept on your browser and offered back to you when you return.
- Revision
- One saved state of a case. Saving again, or accepting newer research, makes the next one. Earlier revisions stay.
- Scenario
- Bear, base or bull. Each is a full set of assumptions from the research, not a confidence interval around the base.
- Line
- One programme in one indication. It is the unit the rNPV values, so a drug in three indications is three lines.
- Driver
- An input that moves a line: peak sales, probability of success, launch year and the rest.
- Bridge
- The headline broken into the rows that add up to it.
- Catalyst
- A dated event that could change a line: a readout, an FDA decision, an earnings date, a conference.
- Evidence pane
- The panel on the right that shows a drug, a line, a disease or a source document beside the model.
Try the first walkthrough on a real company.
The Viking sample opens every panel without an account. Open it, change the assumption you trust least, and see whether the sources back the rest.
Samples: MRNA Moderna · VRTX Vertex · REGN Regeneron · GILD Gilead · BIIB Biogen · ALNY Alnylam · VKTX Viking Therapeutics. Other companies need an account. Start a 7-day trial, no card required.